Apache ECharts
A powerful, interactive charting and visualization library for browser
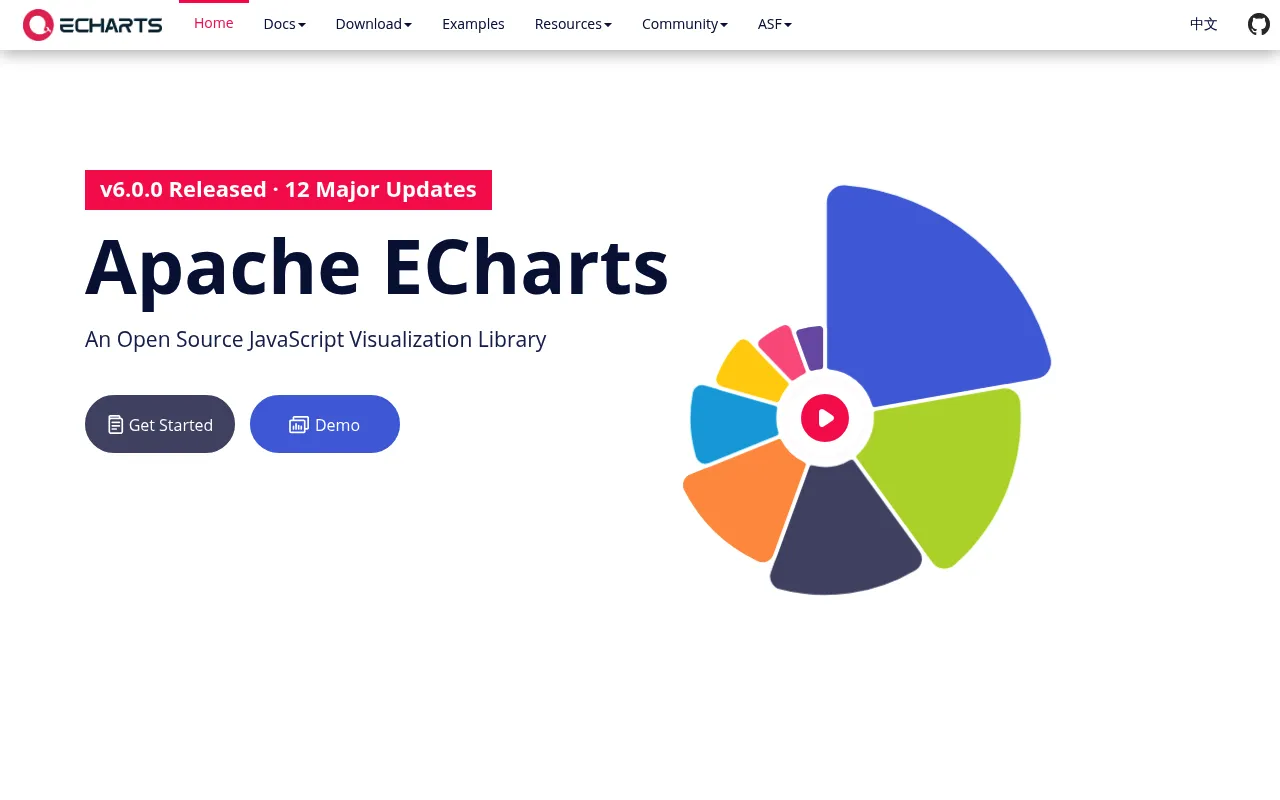
Apache ECharts is an open-source JavaScript charting and data visualization library that supports over 20 chart types with Canvas and SVG rendering. It is designed for building interactive, web-based visualizations with features like progressive rendering, stream loading, and data transforms such as filtering and clustering. The library emphasizes accessibility, responsive design, and extensibility through an active open-source community.
ECharts provides a declarative JavaScript API that renders charts via Canvas or SVG, supporting a wide range of chart types and data transformation capabilities out of the box.
web developers and data analysts building browser-based visualizations
Background.
- Status
- launched
- Business model
- open-source
- Company
- Apache Software Foundation
Similar projects.
Editorial take on the space this project sits in — momentum signals, adjacent moves, our call on whether the wedge is real. Get pinged when we publish a new read or when the landscape shifts.
Have a take on this space?
Tell us what you’d build differently, where you think the incumbents miss, or what we’ve gotten wrong about this project. Comments + reactions are coming soon.