Chartbrew
Track your product KPIs in one place
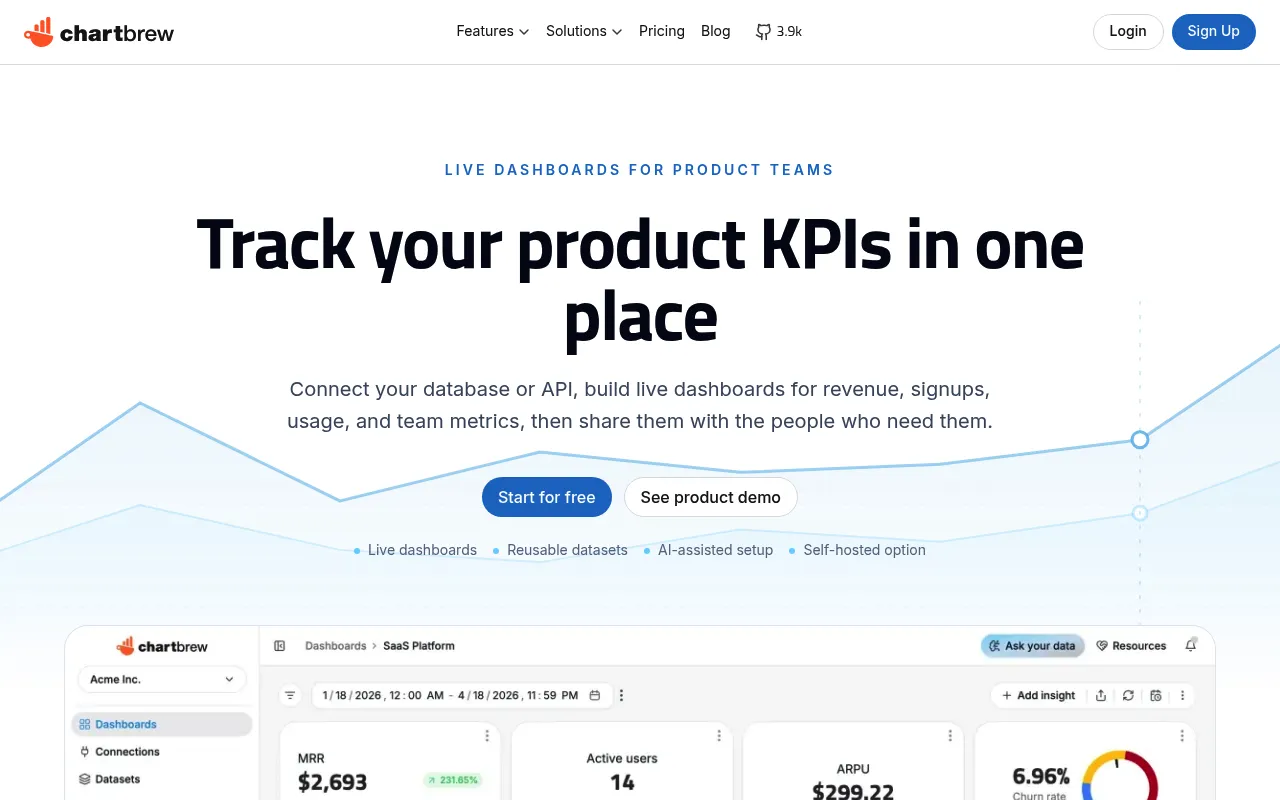
Chartbrew is a live dashboard platform that lets teams connect databases and APIs to build real-time KPI dashboards for revenue, signups, usage, and client reporting. It supports reusable datasets, AI-assisted setup, and a self-hosted option, making it suitable for product teams, SaaS companies, and agencies. Teams can automate report sharing, embed charts, and use a Reporting API without adopting a heavy BI workflow.
Users connect a database or API, prepare datasets, build dashboards, and then automate sharing or embed charts using Chartbrew's interface and Reporting API.
Product teams, SaaS companies, and agencies
Background.
- Status
- launched
- Business model
- freemium
Similar projects.
Editorial take on the space this project sits in — momentum signals, adjacent moves, our call on whether the wedge is real. Get pinged when we publish a new read or when the landscape shifts.
Have a take on this space?
Tell us what you’d build differently, where you think the incumbents miss, or what we’ve gotten wrong about this project. Comments + reactions are coming soon.