FusionCharts
Easiest JavaScript charting library for web & mobile
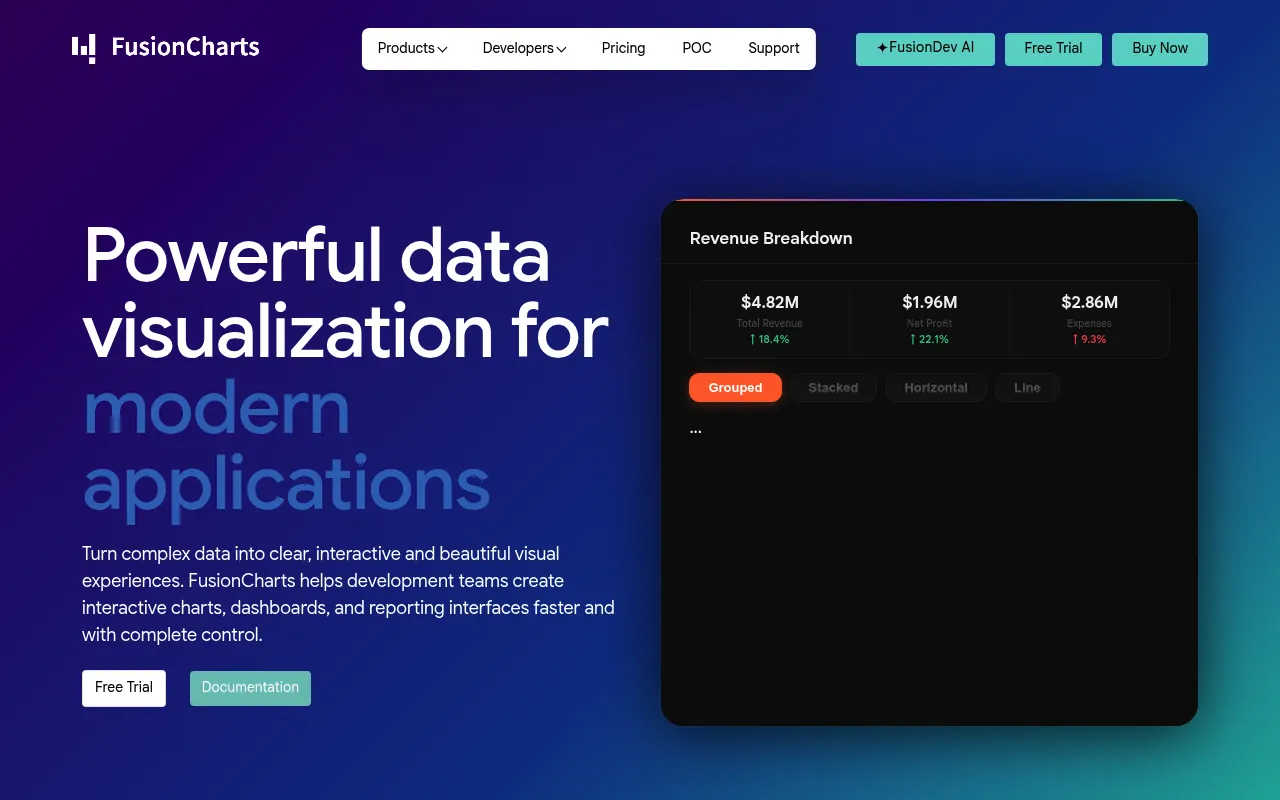
FusionCharts is a JavaScript charting library offering 100+ chart types, 1400+ maps, and grid components for building interactive data visualizations in web and mobile applications. It supports all major frameworks including React, Angular, Vue, and Svelte, and renders via HTML5/SVG for cross-platform consistency. The library is aimed at development teams building dashboards, embedded analytics, financial tools, and real-time monitoring interfaces.
Developers integrate the FusionCharts JavaScript library into their web or mobile app, configure charts via JSON/API, and render interactive visuals using HTML5/SVG across any major framework.
software developers and enterprise development teams
Background.
- Status
- launched
- Business model
- subscription
- Company
- FusionCharts
Similar projects.
Editorial take on the space this project sits in — momentum signals, adjacent moves, our call on whether the wedge is real. Get pinged when we publish a new read or when the landscape shifts.
Have a take on this space?
Tell us what you’d build differently, where you think the incumbents miss, or what we’ve gotten wrong about this project. Comments + reactions are coming soon.