Plotly
The home of beautiful, interactive data visualization.
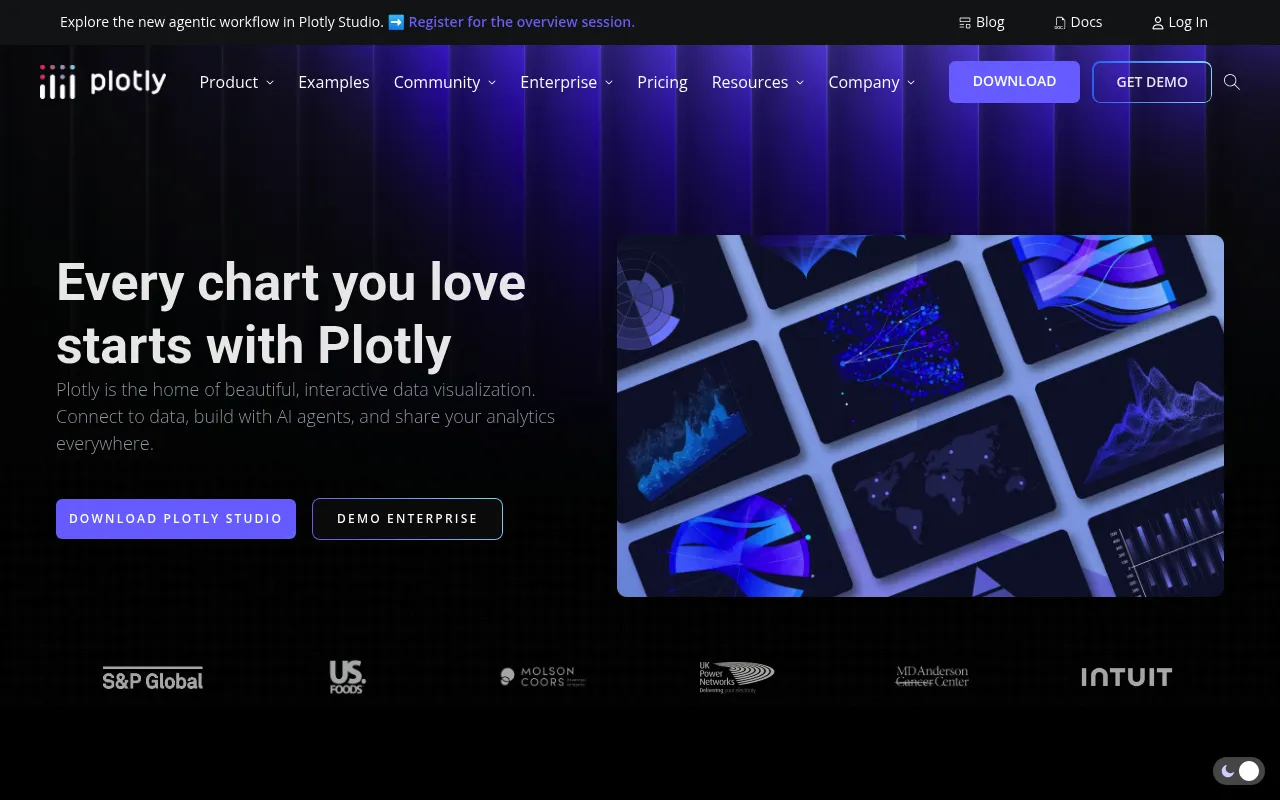
Plotly is a data visualization platform offering open-source graphing libraries, an AI-assisted dashboard builder, and enterprise-grade deployment tools. Teams can create interactive charts and data apps using Python, then publish them via Plotly Cloud or self-hosted Dash Enterprise. It targets industries like finance, life sciences, energy, and manufacturing.
Users connect data, build interactive dashboards and apps using Python-based Dash or AI-assisted tools, then deploy to Plotly Cloud or their own Kubernetes infrastructure via Dash Enterprise.
Data scientists, data engineers, and analytics teams at organizations of all sizes
Background.
- Status
- launched
- Business model
- freemium
- Company
- Plotly Technologies Inc.
Similar projects.
Editorial take on the space this project sits in — momentum signals, adjacent moves, our call on whether the wedge is real. Get pinged when we publish a new read or when the landscape shifts.
Have a take on this space?
Tell us what you’d build differently, where you think the incumbents miss, or what we’ve gotten wrong about this project. Comments + reactions are coming soon.