D3
The JavaScript library for bespoke data visualization
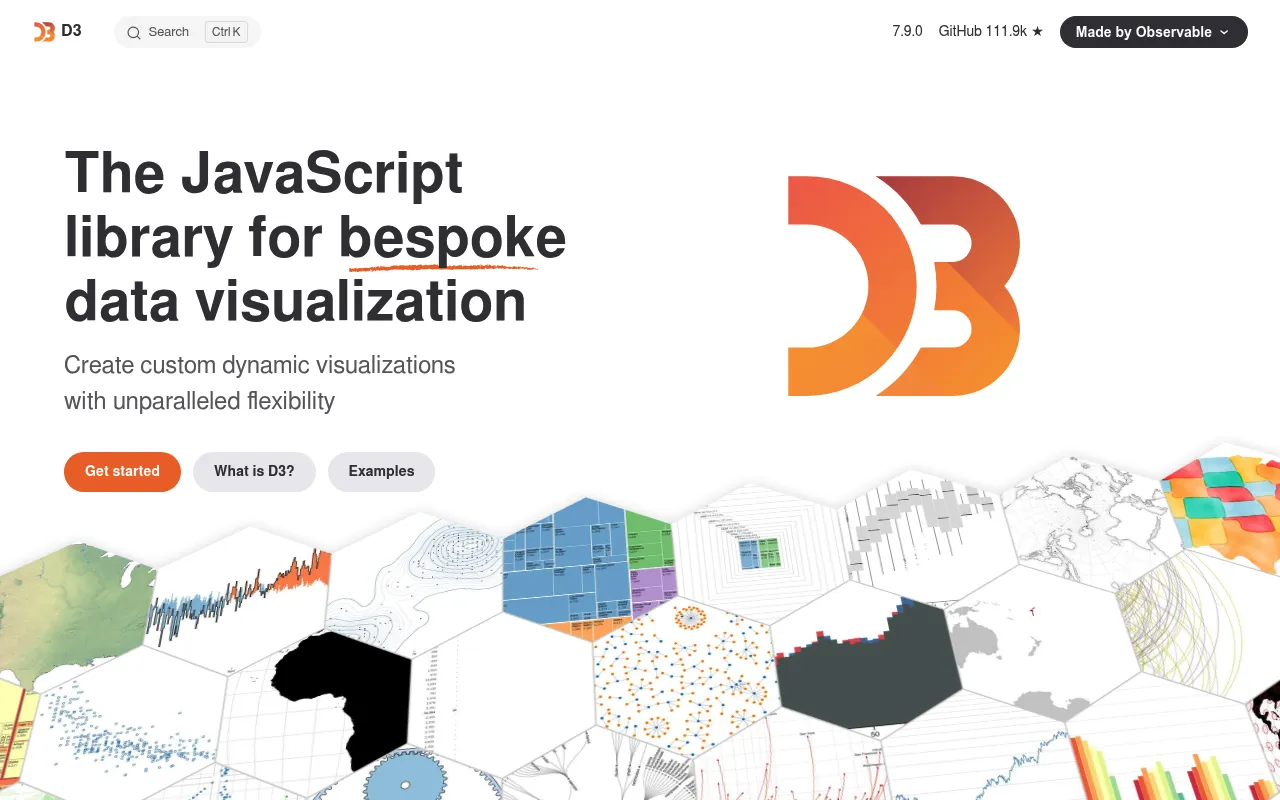
D3 (Data-Driven Documents) is a JavaScript library for creating custom, interactive data visualizations in the browser. It provides tools for binding data to DOM elements and applying data-driven transformations, including scales, axes, shapes, and transitions. Maintained by Observable, D3 is widely used by developers to build highly bespoke charts, maps, and visual data applications.
D3 binds data to DOM elements and applies data-driven transformations using scales, axes, shapes, and transitions to render dynamic visualizations in SVG or Canvas.
JavaScript developers building custom data visualizations
Background.
- Status
- launched
- Business model
- open-source
- Company
- Observable
Similar projects.
Editorial take on the space this project sits in — momentum signals, adjacent moves, our call on whether the wedge is real. Get pinged when we publish a new read or when the landscape shifts.
Have a take on this space?
Tell us what you’d build differently, where you think the incumbents miss, or what we’ve gotten wrong about this project. Comments + reactions are coming soon.