Recharts
A composable charting library built on React components
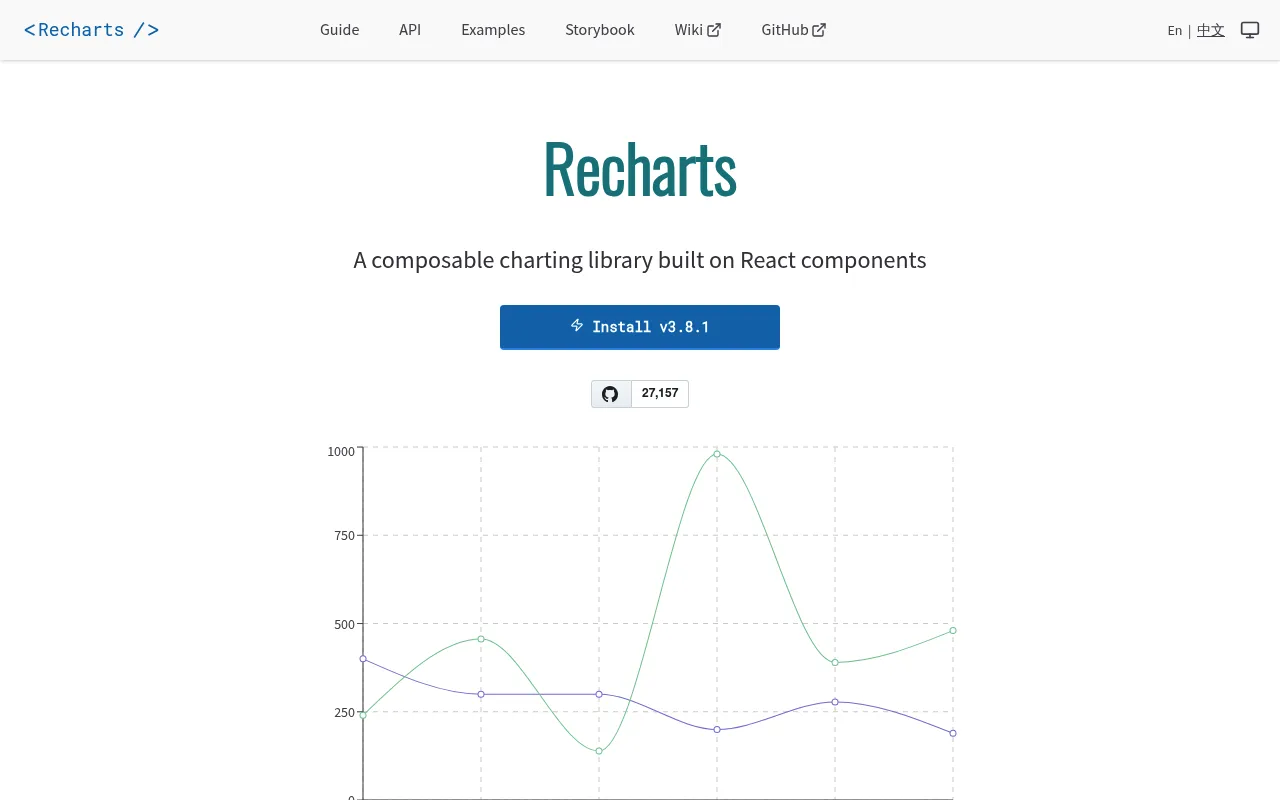
Recharts is an open-source charting library built on React components and D3, designed for building data visualizations in React applications. It offers a composable architecture with decoupled, reusable components rendered as SVG elements. The library is lightweight, customizable, and widely adopted by companies like shadcn/ui and Ahrefs.
Developers compose charts by combining reusable React components that render SVG elements, backed by D3 submodules for calculations.
React developers building data visualizations
Background.
- Status
- launched
- Business model
- open-source
Similar projects.
Editorial take on the space this project sits in — momentum signals, adjacent moves, our call on whether the wedge is real. Get pinged when we publish a new read or when the landscape shifts.
Have a take on this space?
Tell us what you’d build differently, where you think the incumbents miss, or what we’ve gotten wrong about this project. Comments + reactions are coming soon.