Data to Visuals
Turn your spreadsheets into dashboards — instantly
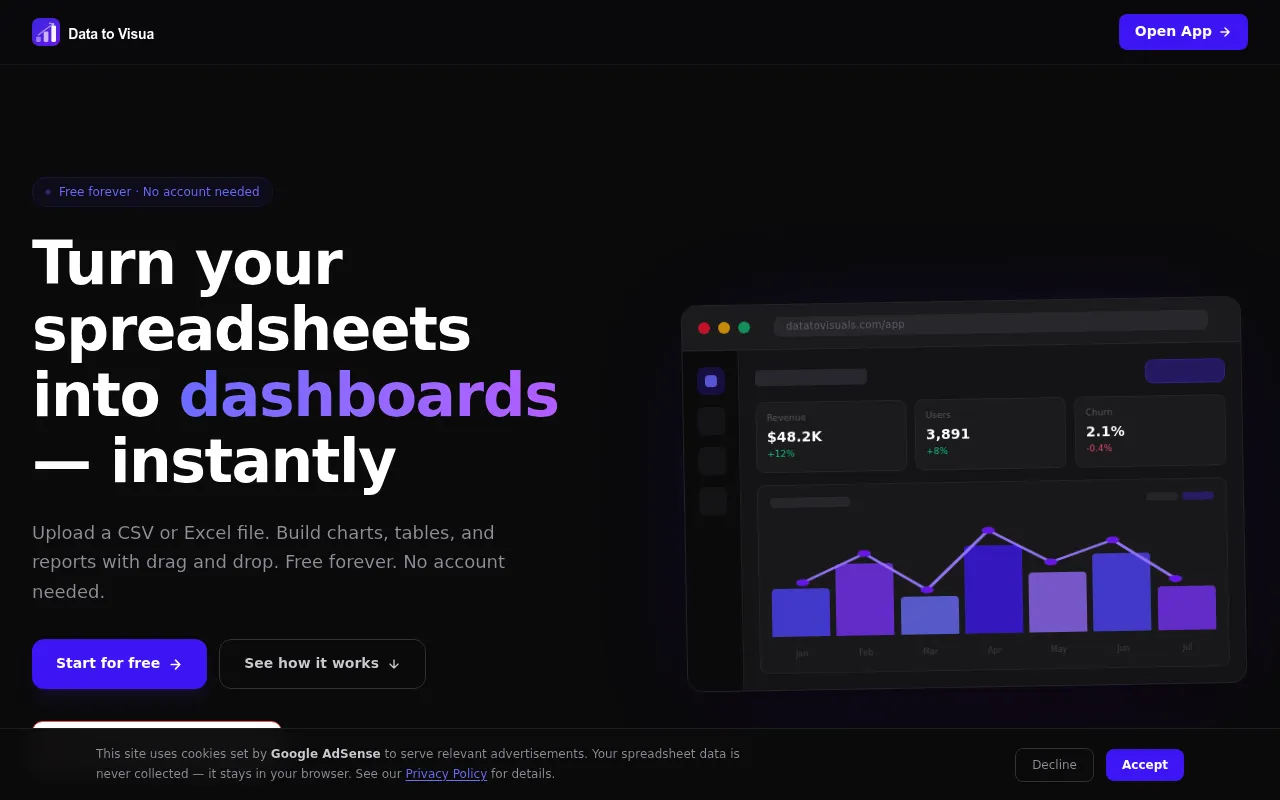
Data to Visuals is a free, browser-based tool that lets users upload CSV or Excel files and instantly build interactive charts, dashboards, and reports using drag-and-drop. All processing runs locally in the browser, meaning no data is sent to any server and no account is required. Users can export their dashboards as PDF or PNG and save their workspace as a portable file.
Users upload a CSV or Excel file, then use a drag-and-drop interface entirely in the browser to build charts and dashboards, with no server uploads or account needed.
Small business owners, students, freelancers, and finance/operations teams who work with spreadsheets
Background.
- Status
- launched
- Business model
- free
Similar projects.
Editorial take on the space this project sits in — momentum signals, adjacent moves, our call on whether the wedge is real. Get pinged when we publish a new read or when the landscape shifts.
Have a take on this space?
Tell us what you’d build differently, where you think the incumbents miss, or what we’ve gotten wrong about this project. Comments + reactions are coming soon.